Search

Elizabeth Morris

Journalism and Economics Major at Ithaca College. Passions: Reading, Baking, Writing and Economics.

Tag

analysis

Lost Questions: Exploring Economic Data and Variables

In my blog last week I mentioned the importance of using data in journalism and using evidence in your argument. While the issue of unsupported arguments needs to be addressed, journalists need to make sure that economic data is used properly and correctly.

In several of my blogs, I’ve talked about issues with variables in data, like the problem with the poverty measurement and unemployment, which can be skewed because of discouraged workers and the labor force participation rate (read my post “Seeing Past the Unemployment Rate”). It is obvious that any side, to prove any issue, will use economic data. As journalists, we need to make sure that the data we use is correct and accurate. Here are some ways to make sure that the data being used in economic articles are beneficial.

Always Pay Attention to the Measurement

Often economic measurements lack an important piece of information. For instance, the exchange rate commonly talked about by the media references the nominal exchange rate, but it is often the real exchange rate that should be referenced. The real exchange rate is the relationship between the domestic country’s goods in terms of the foreign country’s goods. However, the nominal exchange rate is the relationship between the domestic country’s currency and the foreign country’s currency.

Data Used Incorrectly

Data gives the impression that what you’re saying is correct, that it can’t be refuted. I can’t emphasize how wrong that is. Data can be prone to misinterpretation and construed in ways that is not intended, especially if no explanation is given. As an economist or journalist, we must all question the data surrounding us.  A lot of economic data is revised after more information is discovered. This means that journalists should be skeptical of all economic data, no matter where it’s from, be it the government or a private company.

What does the data actually mean?

There may be a reason behind the data that isn’t immediately clear. One big problem with the economy is the multitude of variables that can influence data. This makes it incredibly hard for economists to organize and interpret statistics, and even harder for journalists to explain the issues with data to the audience.

Economic data is changing, statistics are revised, and variables can be missed. As economic journalists we must analyze and decipher the data, but also keep in mind that data isn’t the be-all and end all.

What data have you encountered that has holes in it? What kinds of variables have been missing from data?
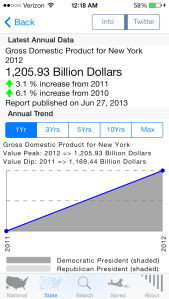
Graph it Out: The Necessity of Data

As an avid news junkie, I’m always trying to figure out how to get information as quickly as possible. I’ve struggled with trying to access websites like the U.S. Census Bureau or the Labor of Labor Statistics on my phone to fact-check something I’ve recently read. There are some apps that I’ve found really useful for those quick checks.

Three Apps for the Economics Obsessed

Economy App

  • Gives economic indicators for both the national and state level
  • Gives not only the most recent data available, but also clearly states where the information is coming from and when it was aggregated
  • Highlights general trends in the data for quick analysis

A2ZEconomy App

  • Organized into categories, from unemployment to gas prices to mass layoff statistics
  • Gives the source and date for data

FRED Economic Data App

  • Push notifications, which is helpful for staying updated on the latest information and trends
  • Organized through different categories, but also through releases and sources
  • Economists and other professionals commonly use FRED, so it’s a great resource to check out online even if you’re not using the app.

Why should we pay attention to Stats?

Now more than ever we run the risk of being overwhelmed with information, especially data. Often the slightest change in data measurement can lead to new results, but whether it’s correct or not depends on the change in measurement. As journalists, we need to organize data in ways that the general audience can understand. More importantly, we need to put the data into context. A general number or statistic means nothing if it’s not compared to anything. As journalists, we can’t report our government deficit without the context of GDP.

There are a bunch of new data journalism sites launching now and in the coming year. This increase in data journalism emphasizes the need for context and, overall, the necessity to focus on evidence.

  • Fivethirtyeight.com – This site is being re-launched with a new backing from ESPN instead of the New York Times. The blog’s writers are skilled in more than just statistical analysis, but also computer programing, data visualization and more. This was launched on March 17, and has had a lot of criticism, but I still hold out hope for the site in the future.
  • The UpShot– New York Times will launch this site, which will focus on explaining the world and connections so that everyone can easily understand. They will also use data as a tool to describe events and issues. But they make sure to state that data is only effective if it is used properly and to clarify reality.
  • Vox.com– this is a new blog to launch soon by former Washington Post Blogger Ezra Klein that will also focus on this new form of journalism.

How do you stay up to date on data? Have you found that data visualized engages you in a story more? What would you like to see in journalists’ explanations of data?

Create a free website or blog at WordPress.com.

Up ↑